Analysis of emissions between ICE and EV scooters

Like many, I thought that in India, since most electricity generated is by burning coal, large transmission losses in the grid (from the power plant to the vehicle) and that battery technology also generates significant emissions, the net emissions of electric vehicles (EV) as compared to internal combustion engines (ICE run on petrol) may be similar if not more. That is until I recently mentioned this point with Tarun from Ather energy.

He mentioned how, even after all of this (Thermal power plant, Transmission losses, Battery manufacturing), the net emissions are better than ICE over a while. This is mainly because of the inefficiency of internal combustion engines. He mentioned that coal power plants use scrubbers that clean the gases before release, and the waste is now used for road construction. In the case of ICE, that doesn’t happen at the vehicle level when petrol/diesel is burnt to power the engine.

So yeah, I asked him if he could share more information. I will share the link to this thread and ask Tarun or his team to respond to any follow on queries here.

As discussed, sharing the research here. It’s a 9pg pdf.

It’s based on this paper from ICCT. We did some informal checks with the researchers to double verify the math and accounted for some gaps (in our view) over and above that.

It’s actually a slightly biased math in favor of ICE since most practical data tells us that ICE scooters average 40-45kmpl (not the 50 that we considered) + we have taken a range of 75kms for the EV while real world data is closer to 90kms today.

Summary

This document provides comparison between Lifecycle emissions of an EV and ICE
scooter for a period of 12 years and 12,000 km in an Indian context. Summary chart is
as follows

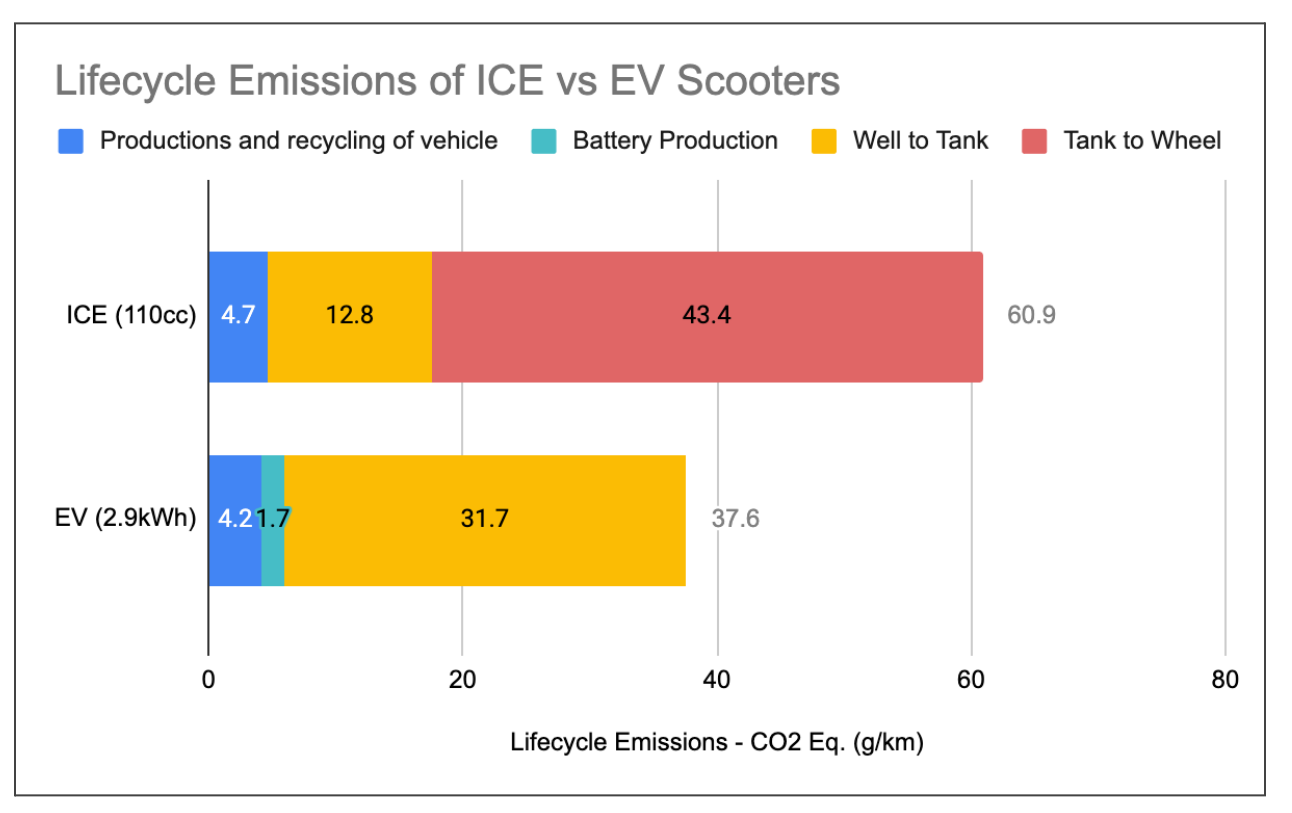
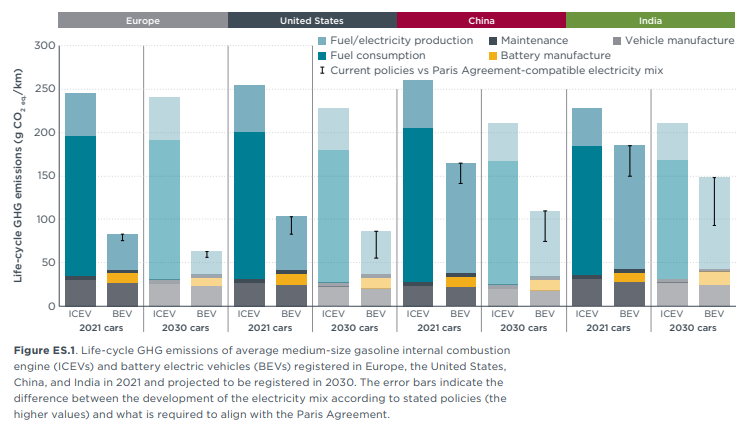
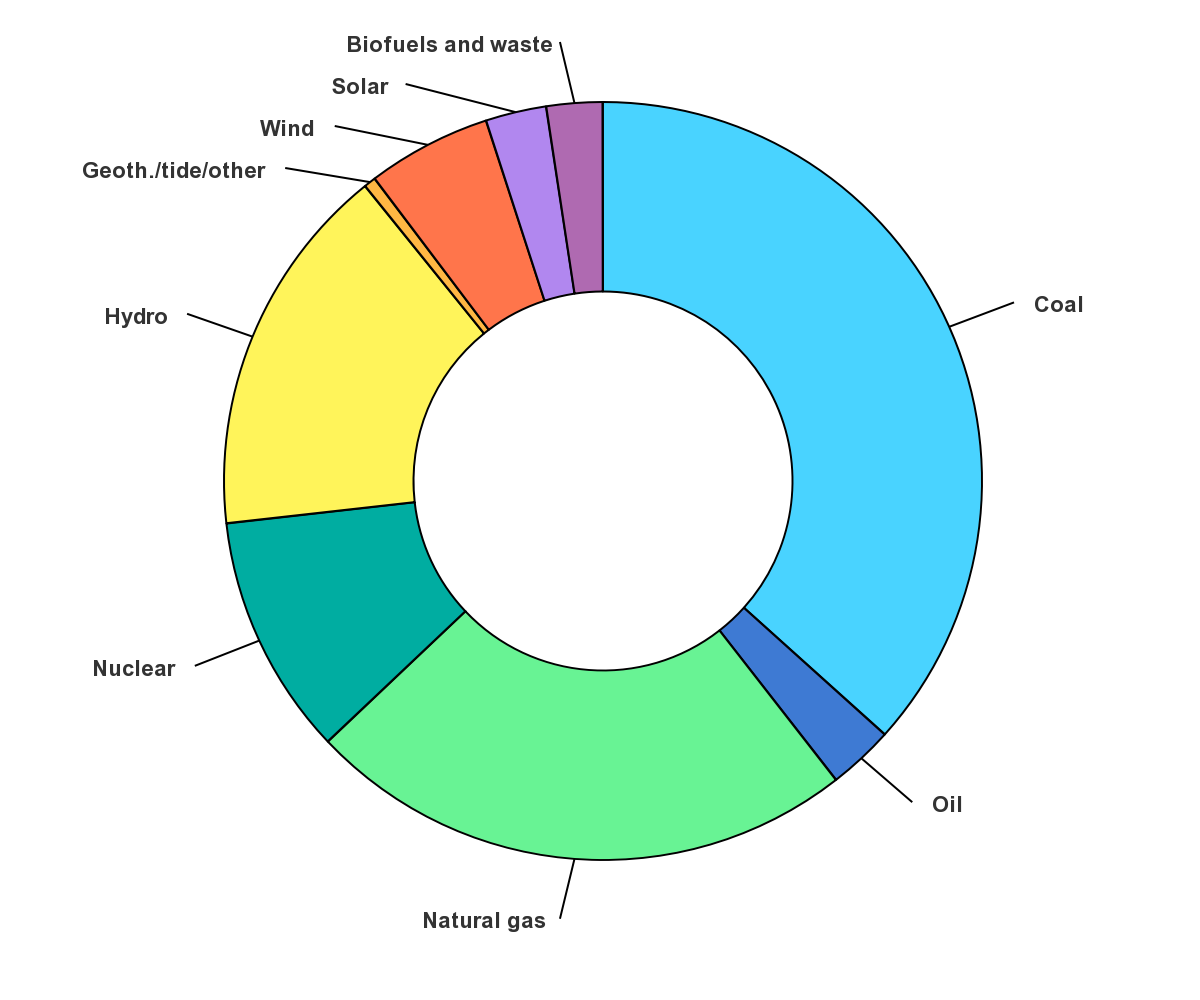
● Electric vehicles have higher “Well to Tank” emissions due to the Indian
electricity grid generation primarily being Coal based.
â—Ź Electric vehicles have a marginally higher manufacturing emissions due to
battery manufacturing.
â—Ź Tank to wheel of an average IC Engine 2 wheeler is high enough even after
improvement of emission norms taking total emissions to > 60 gm CO2eq/km
â—Ź Accounting for all of it, lifecycle emissions over 12 years are still lower by around
38% for Electric vehicles compared to ICE vehicles.

Details of assumptions and comparisons can be seen in this document.

2 Likes

I have a few questions.

  1. How much will well-to-tank reduce for EVs if electricity from Solar or other renewable energy sources?

  2. Can folks set up solar plants at home and power their Ather scooters through that? Is this already happening?

  3. Does the math look similar for cars (EV) as well?

1 Like

Interesting that you ask this. In response to question #2 of yours, we have recently bought an Ather scooter, and it is charged exclusively from the solar panels we set up when we built our home.

So now one has to factor in the emissions (and other environmental effects) of the household solar PV system - panels and batteries mostly.

2 Likes

Hi Nitin,

Thanks for bringing this up !!!.
I feel it’s way more complex than this as there are so many unknowns. FYI, I drive a Nexon EV and have a solar rooftop aswel. But here are my thoughts beyond the regular Matrix of Coal vs Battery.

  1. How do you calculate the footprint Fossil fuel supply chains. For e.g dedicated Trucks are manufactured for carrying fuel to the Bunks, Making the petrol bunk itself etc…

  2. How do you account for the Damage done by transmission infrastructure, for many transmission infra is built in the forests, what if EV adoption puts pressure to double that infrastructure.

But the pros and cons list is endless of we start looking at every aspect

3 Likes

Hi Nithin,

Thanks for posting this. However, as Vikas pointed out, there are a lot of unknowns, which creates space for and opportunities to introduce a lot more efficiencies in these areas to even capture and further analyze the emissions. However to understand to understand the math for EV Cars vs ICE cars, I found a paper online:
Understanding emissions between ICE cars and BEV cars

One major comparison found on that paper:

2 Likes

Thanks for this.

1 Like

@Yeshvanth_suresh

What happens to this 31.7 if well to tank to is your home installation of solar panels like in the case of @suhelq

That was quite a good analysis. A similar analysis was done for PVs by BOB capital. As per their calculations, PVs powered by CNG have a lower footprint as compared to coal powered EVs at this point of time

More than a technological problem, I feel we are in the midst of a psychological problem. Around 20 years back, having cars was a luxury - like a status symbol. 10 years back having a car became a necessity. Despite congested roads, easy access to public transport (atleast in Mumbai), cars had become a must have from good to have. Now, despite the road size remaining the same, increasing pollution, massive construction happening (I’m speaking mainly for Mumbai here), cars are being upgraded. From small hatchbacks, cars sizes have increased by 20-25% easily. Whatever technological upgradation we may have had in fuel consumption might’ve been lost just by the substitution of smaller cars with bigger ones.

Questions that we need to mull about are:
Is having 2 EVs per family more sustainable v/s having 1 ICE car?
Why is a city that is revamping its public transport massively not disincentivising private transport?

I also feel that decarbonization of private vehicles gets too much limelight as compared to its actual share of GHG emissions viz ~7%. Iron and steel industry as a standalone has similar levels of emissions and it doesnt get discussed much!

3 Likes

@NithinKamath drawing 2 scenarios here with few assumptions and references in place.

Scenario 1:
However, if we look at the larger picture of our Indian grid, if country succeeds in meeting the goal of obtaining 50% of our energy needs from renewable sources (Solar + Wind+ Hydro), then we should see a 35% reduction in the WTT component and a 56% reduction in lifecycle emissions compared to a 110cc ICE scooter.

Scenario 2:
If a person has a solar photovoltaic microgrid at home, emission would be kept to a minimum. (Near zero for the WTT). The only time there will be emissions is when these solar panels are made. Hence the lifecycle emissions would be 86% less than the ICE scooters’ emissions

Ref link for emissions for various means of electricity productions

Thanks for this. One last thing, Tarun was also talking about how India is far ahead of all countries regarding 2-wheeler EV tech. I was quite excited to hear that India is leading others. :grinning: Can you briefly explain the reason for that, for the benefit of others?

1 Like

I went through this rabbit hole when I was planning to get Nexon EV and solar system. From my understanding the accurate calculation of emissions is nearly impossible because like many here mentioned there are way too many variables. It is almost like calculating weather for next week, yes we have numbers but we are not sure about it. I’m sharing some points I hope are relevant to the discussion:

  • Solar panels last really really long time and need little to no maintenance. Manufacturing emissions and ownership cost break even happens in 4-5 years.

  • EVs and solar promoting electrification has secondary effects that reduces emissions. In my house cooking is almost always done on induction cookers. It is superior in every ways. My dad told me yesterday we haven’t bought a new cooking gas cylinder in a year.

  • Electricity is the best way to produce, distribute, store and consume energy. There are many ways to produce, unlike fossil fuels which are concentrated in certain places. Production is democratized, anybody can produce it. Distribution loss is negligible compared to fossil fuels. Distribution is instant, you can start a power plant and energy is available at the other end at the speed of light. Efficiency at every step is more than 90%. Solar system in house practically short circuits this and makes the house energy self sufficient.

  • EVs running on electricity generated from fossil fuels are still better than ICE cars. A power plant is a controlled environment and it burns fuels at a nearly steady rate with lot of checks and balances on the emissions. It is always efficient compared to a car which apply very little incentives on efficiency. Once an ICE car is given out to public there is nothing we can do about the emissions for the next 10 years. It has irregular emissions at different speeds and the overall emissions increase as it ages. In case of a power plant, emissions are centralized, hopefully in a remote location, away from the dense population. And Government can enforce regulations and science can apply new advancements to the plant in order to reduce emissions and it is instantly effective to the fleet.

  • Lithium mining has lesser impact than fossil fuel extraction. Lithium is a helping agent to store the energy but fossil fuels “are the energy”. So you have to keep on mining fossil fuels as per the energy needs but there is an end to Lithium mining. Because Lithium is a metal that is infinitely recyclable, only the battery chemistry degrades after sometime, Lithium stays intact. And after a certain point recycling is easier and cheaper than mining new Lithium. US has couple of companies that sustainably does this. I think India doesn’t have enough end of life Lithium batteries to kick start this.

  • Batteries with new chemistries can be retrofitted on to existing fleet. If the new chemistry has better energy density vehicle gets more range. EV only cares if the battery can provide electricity at certain voltage levels which can be adjusted. An ICE car engine is very specific about the fuel and the mixture.

7 Likes

Sure @NithinKamath , will post more details on the same.

1 Like

That’s very informative @ajinasokan. Thanks!

Please do share a post on your home solar setup as well.

1 Like

“He mentioned that coal power plants use scrubbers that clean the gases before release, and the waste is now used for road construction.”

On all the other parameters, EVs might be better than ICEs but with respect to this sentence, same emission reduction could be said about refineries which produce petrol/diesel. The refineries could use carbon capture and minimize their emissions

Not talking about the refinery, which is already captured in well to tank in the image.

Talking about the engine in the vehicle itself, that is when the motor burns petrol/diesel to generate power (tank to wheel). Impossible to have scrubbers etc., to clean the gasses, the type which is in a thermal power plant in a 2-wheeler or car.

There are more than 65,000 gas stations in the country but only 1,640 EV charging stations. Petroleum companies are expected to come up with a plan for 22,000 EV charging stations by 2024. In comparison, China has approximately 900,000.

“Every street lamp can also be turned into a charging station with the swipe of a credit card.”

Looks like endless possibilities.

From: India: How electric vehicles are driving a green transition – DW – 03/17/2023

2 Likes

@Its_RJ adding on to Nithin’s point.
We should consider possibilities that the larger Well to Tank component, which is now higher from EVs stand point and has potential to decrease with the changes in current grid ratios. More renewable energy sources correspond with the global and national goals of decreasing carbon footprint. (with the contribution of existing renewable energy sources being less than 20%)
Therefore, the improvements are not just with decreasing emissions at coal power plants which is the one of the main source; it also with gradually reducing the reliance on coal power plant output.

Road to increase the Renewables

Volvo are one of the few manufacturers that provide a Life Cycle Assessment (LCA) of the Carbon Foot print of their cars.

The Carbon footprint is calculated assuming the cars cover 200,000 km in their lifetime.

Three Volvo models are compared below; the XC40 Recharge, C40 Recharge, and Polestar 2, their emissions are compared to the XC40 ICE (Internal Combustion Engine, Petrol).

There are two data points of interest.


First, the comparison of Lifecycle emissions for the ICE vs the EV, which answers the question above partially:

For the XC40 Recharge:

For the C40 Recharge:

For the Polestar 2:

It’s quite clear that with the global electricity mix (coal predominant) the EV has very little advantage (6-14%) over the ICE in terms of lifecycle emissions. Numbers start getting better as the cleanliness of the power supply (grid) itself gets better.


Second, Volvo quantifies this “over a while” to give cross over points, i.e. number of kilometres run after which the EV actually has net lower emissions over the lifetime, compared to an ICE vehicle.

For the XC40 Recharge:


For the C40 Recharge:

For the Polestar 2:

This accounts for the Well to tank, and Tank to Wheel emissions and gives us the number of Kms EVs need to run for to break-even/cross-over into having less lifetime emissions compared to ICE.


Given India’s electricity mix is similar to the global electricity mix, with power generation predominantly from coal, we can conclude that the break-even/cross-over point for EVs in India will range in the 110,000 - 150,000 km range, provided the emissions during production, and End of Life are similar to Volvo’s numbers.

Global Electricity Mix [4]:

India Electricity Mix [5]:


Disclaimer: I’m not affiliated with Volvo, just a huge fan of their philosophy, and cars.


References:

  1. XC40 Recharge: https://www.volvocars.com/images/v/-/media/applications/pdpspecificationpage/my24/xc40-electric/pdp/volvo-cars-LCA-report-xc40.pdf
  2. C40 Recharge: https://www.volvocars.com/images/v/-/media/Market-Assets/INTL/Applications/DotCom/PDF/C40/Volvo-C40-Recharge-LCA-report.pdf
  3. Polestar 2: https://www.polestar.com/dato-assets/11286/1600176185-20200915polestarlcafinala.pdf
  4. IEA, World gross electricity production by source, 2019, IEA, Paris https://www.iea.org/data-and-statistics/charts/world-gross-electricity-production-by-source-2019, IEA. Licence: CC BY 4.0
  5. IEA, Total primary energy demand in India, 2000-2020, IEA, Paris https://www.iea.org/data-and-statistics/charts/total-primary-energy-demand-in-india-2000-2020, IEA. Licence: CC BY 4.0
4 Likes

Thanks. Understood

Thanks a lot for the detailed explanation @Vivek-Gowda