Innovation Challenge #2: Mining Insights from Events
Motivated by Google’s Groundsource project which identified urban flood events from news articles and used them as training data to forecast floods from weather and geospatial data, we have built a generic pipeline to extract different types of events from news articles and are inviting researchers and innovators to mine novel insights from these signals.
Almost entirely through AI-generated code by Cursor’s Composer 2 and Claude’s Sonnet 4.6, we built a pipeline that reads a meta JSON which lists search keywords, a date range, prompts to extract events from the news articles, and event group for different categories. Here’s the Github repo. We wrote 3 meta JSONs to detect human-wildlife conflicts, crop damage events, and avian flu and wild bird death events. GDELT was used to identify relevant articles for the given keywords and categories, a combination of Jina and Selenium to download the articles, and the qwen2.5:14b LLM model running locally using Ollama on a GPU workstation to extract structured information from the news articles.
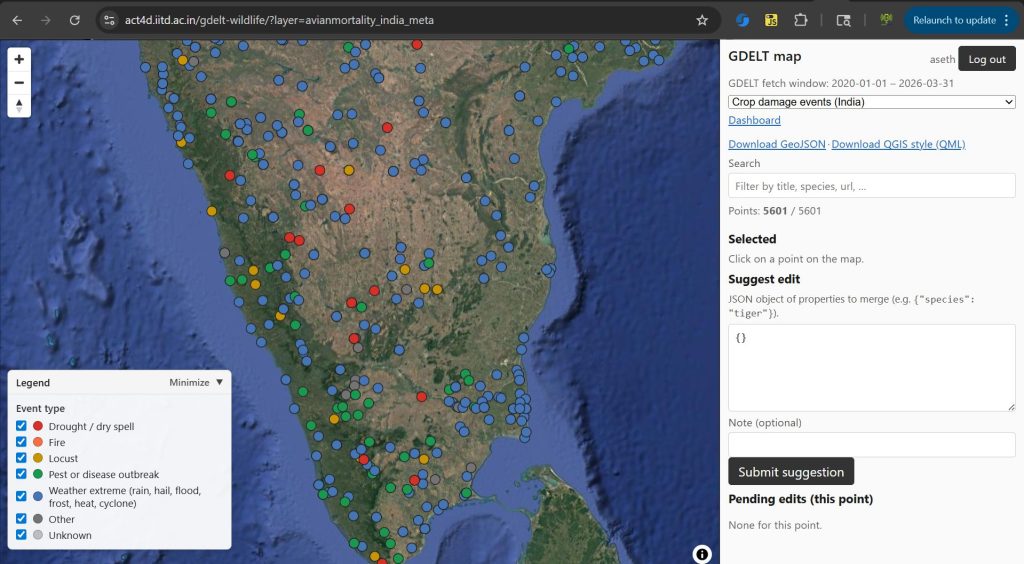
Check out the maps and dashboards generated through this process: GDELT wildlife map
The setup also allows users to provide feedback and flag errors. A moderator can review these suggestions and approved ones are added to git for version tracking.
The human-wildlife conflict map groups events based on the animal species, whether the animal was injured or killed or were humans, and the type of conflict.
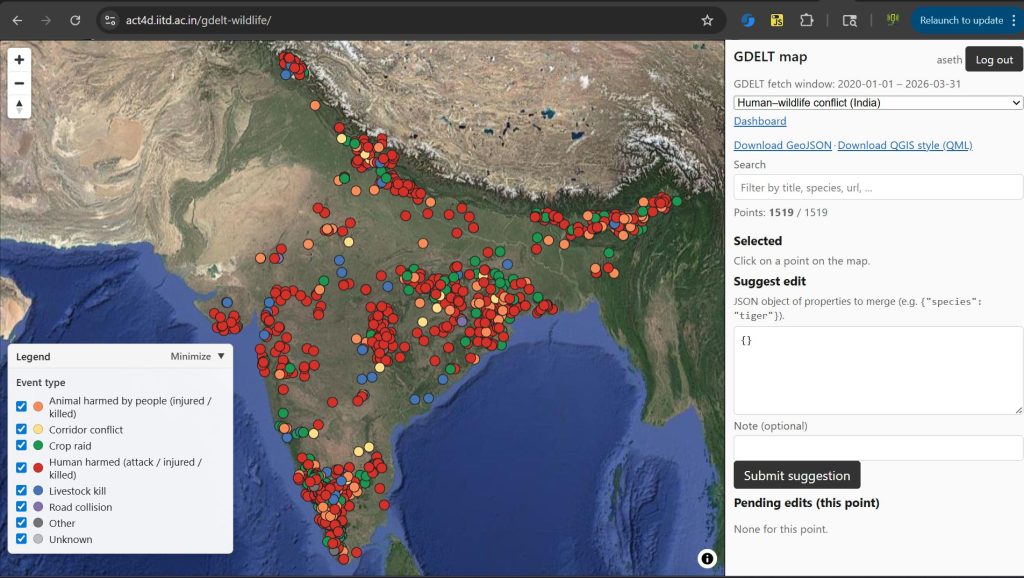
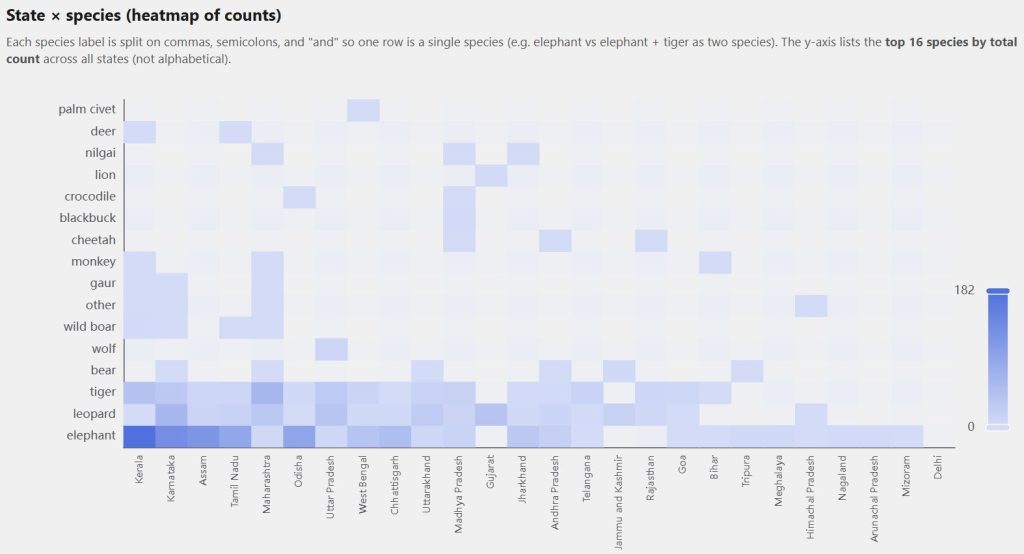
You can review which animal conflicts are more prevalent in which state.
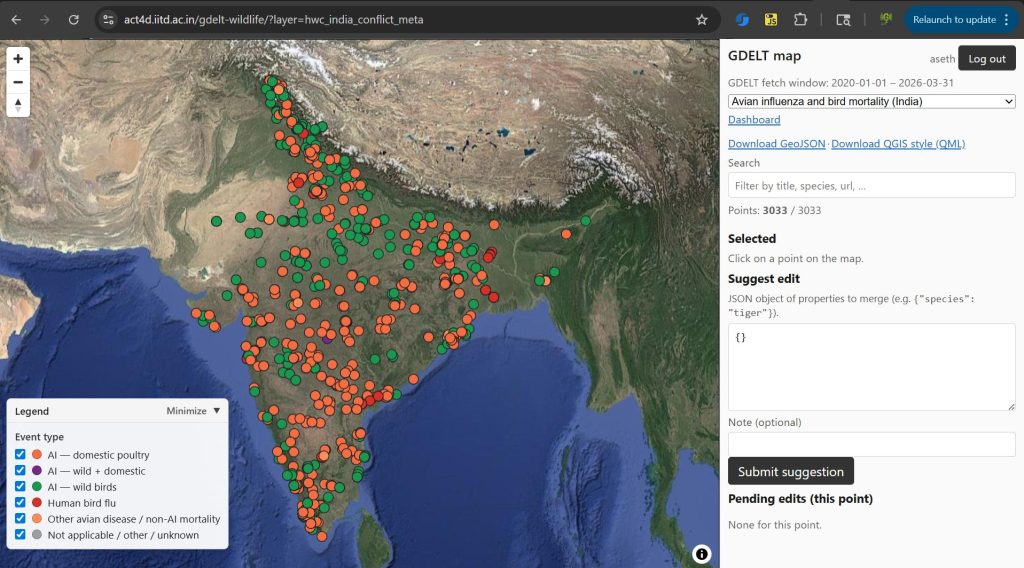
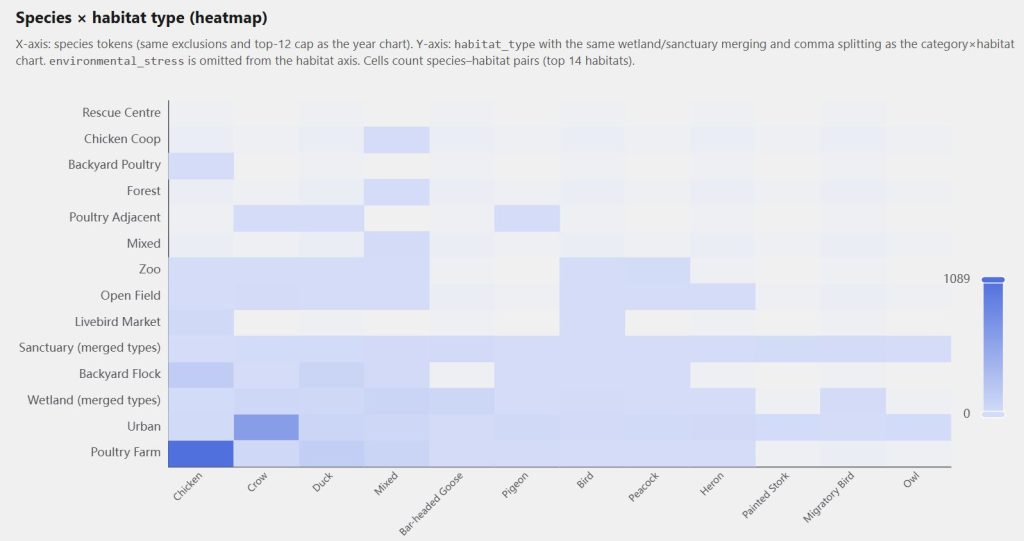
The avian flu incidences and deaths of wild birds dataset identifies the species and habitat.
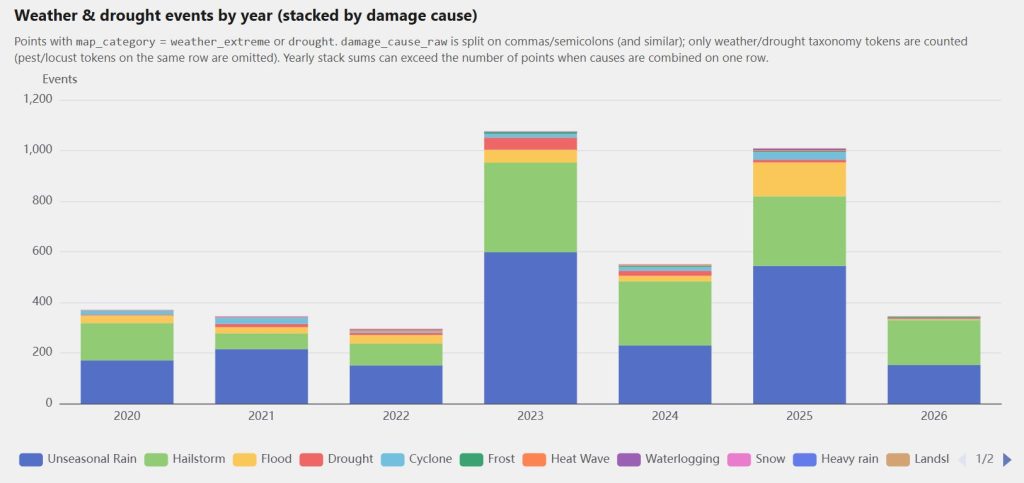
Crop damage events are organized as being triggered by extreme weather, pest attacks, locust attacks, droughts, and fire or wildlife incidents.
There is certainly room for improvement: occasional non-events do make it through the filters, event de-duplication may still show multiple instances of the same event, and geo-coding can have issues, but by and large the maps seem good. We hope to analyze the accuracy more systematically and add tests to flag potential errors that can be checked by volunteers.
Research and analysis ideas
Human-wildlife conflicts
- Overlay with CoRE stack datasets on LULC change detection to see if areas witnessing more conflicts than others are also seeing drastic changes in forest fragmentation. Similarly use drought events data in the CoRE stack to see if crop raids by elephants occur more during drought periods. Can this be used to build a risk monitor, E.g. are climate variables, distance of settlements from forest edges, evidence of forest loss, surface water availability, etc. predictive of conflicts?
- News articles of course have biases in their coverage. Can ideas from species distribution modeling where only positive presence samples are available and negative pseudoabsence samples are created through different strategies, be used to spot potential locations that are not actively covered in news reports?
Avian flu and bird deaths
- Overlay this data with eBird reports to identify areas, especially wetlands, where such events happen but eBird coverage is low. This can be used to build targeted observation campaigns to monitor bird species and migratory patterns in these areas.
- Are poultry bird flu events occurring more frequently in areas close to wetlands? Use CoRE stack surface water datasets to find the proximity of these events to waterbodies, and likewise also see if climatic conditions or leading signals like reports of deaths of wild birds or changes in migratory patterns in wetlands are predictive of bird flu incidences in poultry farms?
Crop damage and risk forecasts
- Compare crop damage events data with PMFBY coverage. Do areas with frequent events indeed have a good crop insurance coverage? What kind of insurance claims were made during these reported events?
- Identify compound crop damage events: Areas which saw droughts and dry spells during Kharif, and unseasonal rain or hailstorms during Rabi.
- See if remote sensing signals like NDVI are able to spot impending crop damage in drought scenarios. With Sentinel-2 revisiting each pixel every 5 days, if even 1-2 weeks of advance signal can indicate deteriorating crop health it can be used to trigger early warning alerts. Or conversely, ex-post, see if remote sensing signals can assess the extent of crop damage — will need additional datasets for validation though.
- Can pest attacks data be used as positive samples to build a predictive model that can forecast pest attack risk based on climate variables, crop type, and crop health proxied through NDVI.
- 2020 was a year of heavy locust attacks all across India. Use the event dates and windspeed and direction data from that time to trace the trajectory of locust swarms. Is windspeed predictive of the direction they take? Predicting locust swarm paths is a hot area of research!
Combining the datasets
- Are some areas seeing compound stress with crop damage and wildlife conflicts? What characterizes these areas? Our hypothesis is that poor presence of extension services, higher exposure to ad hoc land-use changes, and inadequate provisioning or utilization of social protection measures, are often correlated and subject communities to increased vulnerability — high exposure, low adaptability, high sensitivity.
Join the innovation challenge
Join our weekly dev call on this coming Friday April 10th at 3pm to learn more and discuss ideas on how to use these datasets. If there is good interest then we are happy to go all out — build a live system that updates in real time, go further back in the past, mine new types of events — and at the same time we are working hard to scale the computation of geospatial datasets on the CoRE stack to pan-India. We will get these very soon…